


Cardiovascular diseases (CVDs) still represent the most common cause of morbidity and mortality worldwide, despite the impressive improvements in patient prognosis achieved in the last decades through several innovations in the diagnosis and management of a broad spectrum of CVDs.1–7 Nonetheless, the growing prevalence of cardiovascular risk factors and the better prognosis of patients with CVDs has resulted in an increase in the global CVD burden.8,9 This evolving epidemiologic pattern raises important socioeconomic issues.
Indeed, preventive measures are pivotal in limiting the risk of onset and progression of CVDs, but their safe and effective implementation largely relies on the precise identification of the patients at risk. In addition, the significant costs and potential side-effects of new drugs and devices, which have been shown to improve patients’ prognosis, require careful consideration of the possible benefits that any patients could derive from their use. Bearing this in mind, the need for accurate prediction models in the cardiovascular field is more relevant than ever.
The most used approach in this field is still based on regression models, which help to predict the occurrence of adverse events and elucidate the relationship between specific variables and disease course.10 The use of regression techniques, thanks also to their optimisation (e.g. forward or backward stepwise selection of variables), has been pivotal in identifying and characterising the impact of demographic features, comorbidities and biomarkers in the pathogenesis and progression of CVDs, as well as in the development of the risk models widely used as prediction tools.11–13
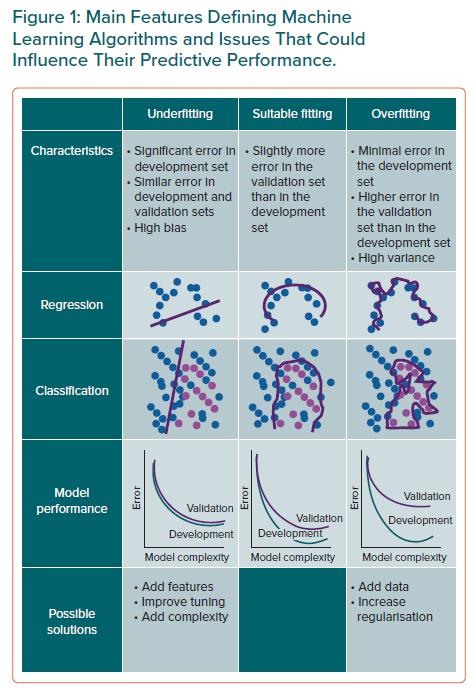
Nonetheless, regression techniques, such as logistic or Cox regression models, are based on assumptions that could limit their use or reliability in specific settings, such as the assumed linear and homogeneous relationship between variables and outcomes and the need for the pre-selection of variables on the basis of prior hypotheses.14,15 Notably, these premises could hinder the use of regression techniques in the case of complex diseases, which are commonly characterised by a tangled interplay between potential predictors and clinical outcome. In this context, the use of algorithms based on artificial intelligence (AI) is gradually spreading in the field of cardiovascular research. Under the umbrella represented by the term ‘AI’ lie several different algorithms characterised by specific properties, which in turn influence their applicability according to the study population, the available variables, and the outcome of interest. Despite the rapid expansion of their use in cardiovascular research (Figure 1) and in daily patient care, the questions of how AI algorithms work and how they are built and validated remain unclear or blurred to the vast majority of clinicians. The aim of the present review is to provide an introduction to the most common AI algorithms, the benefits that could be derived from their use in place of the classic regression methods, and their potential pitfalls, with a specific focus on the use of AI for risk prediction in CVD.
Limitations of Regression Techniques
Biomedical research, including the cardiovascular field, has used classic statistical methods for decades. Regression techniques remain the mainstay in the search for predictive variables able to explain the occurrence of cardiovascular events, such as MI or HF hospitalisation, with the final aim of identifying patients at the highest risk of a specific outcome based on the presence of such variables. Similarly, some of the most widespread risk scores for the prediction of cardiovascular adverse events have been developed using logistic or Cox regression analysis. However, the reliability of regression models might be reduced by some of the assumptions they are based on.
These models usually include a limited number of easily available variables associated with the occurrence of the event. The first step in the development of a predictive model of dichotomous outcomes based on regression techniques is the selection of candidate variables to be included in the model. This selection is based on prior hypotheses and, in part, on the availability and cost of candidate variables. The regression model determines the parameters (or weights) of the candidate variables (independent variables), the combination of which enables the prediction of the outcome (dependent variable). After the predictors of the adverse event are derived by multivariate logistic or Cox regression analysis, a weighted risk score might be derived, commonly by summing the integer assigned to each variable based on a coefficient derived from the model. The strength of the association between risk factors and adverse events is then reported in a clinically interpretable way (e.g. odds ratio, relative risk or hazard ratio).
In the case of continuous outcomes, linear regression models assume that the relationship between a risk factor and an outcome is linear. The assumption of linearity is plausible for many risk factors and cardiovascular events, such as glycated haemoglobin or smoking pack years. Nonetheless, it is an oversimplification in the case of many other risk factors, such as in the case of the J-like relationship between blood pressure and cardiovascular and all-cause mortality.16,17
Another potential limitation of regression models is related to the common occurrence of interactions between variables in complex scenarios, which arises when the relationship between the risk factor and the outcome is modified by the presence (or the value) of other variables. In fact, regression models could only partially account for the heterogeneity of effect of a risk factor related to its interaction with other features. Last, the choice of candidate variables may represent another critical challenge in the development of a regression model. Appropriate selection not only requires statistical knowledge, but it also relies on clinical, biological and epidemiological evaluation. Moreover, the inclusion of many predictors, especially in the case of rare events, could lead to the overfitting problem, which refers to the scenario in which the model fits well on a training dataset but does not generalise to unseen data, thus leading to poor predictions in the validation dataset. A rule of thumb, commonly referred to as the ‘one in ten rule’, is widely used to suggest how many predictor variables can be included in hazard models in survival analysis and logistic regression, in order to limit the risk of overfitting.
In contrast, AI algorithms could potentially overcome some of these limitations. For instance, when the aim of a study is to predict the occurrence of MI, without any focus on the strength of the association between potential risk factors and the event, a machine learning algorithm can better model complex non-linear relationships between predictors and the outcome than classic regression models. AI methods allow for a hypothesis-free and data-driven approach, suitable when the final aim is to discover common features or differences in metabolomic patterns, patient risk profile, or to guide a tailored approach in terms of drug or device and, in turn, improve healthcare delivery taking into account cost-effectiveness issues.
Artificial Intelligence, Machine and Deep Learning
AI is the general term referring to automated systems capable of carrying out tasks that need ‘intelligence’. Machine learning is instead a more specific definition used to describe the process of developing systems with the ability to process and learn from data to extract meaningful patterns (unsupervised machine learning) and/or produce an output (supervised machine learning). The output can generally take the form of a continuous variable (i.e. regression task) or a class label (i.e. classification task), depending on the specific machine learning method and predictive task (Figure 1). Examples of output are predictive models that categorise different images in risk classes or infer the occurrence of a disease (Table 1). In many cases (see below), the development of a predictive model requires that the dataset includes the output (or target variable), which is the outcome that the model is learning to predict. For instance, in the case of a model with the aim of predicting the occurrence of MI, the label is the occurrence of the event (positive class) or the absence of the event (negative class).18 The input variables, such as demographic characteristics, comorbidities in a population, or specific components of an image, are referred to as features or attributes. Irrespective of the specific method applied, the development of a predictive model through machine learning requires a development dataset and a validation dataset. The development dataset is used for training the model and to adjust model parameters, which are the internal values of the model derived by the algorithm in the training phase, such as the weights assigned to the coefficients in a regression model, in order to best match the model output with the reference represented by the label (e.g. the occurrence of MI). Hyperparameters are instead parameters established a priori, before the model is trained, that are tied with the model mechanics, for example the topology of a neural network, and can influence the learning process as well as the accuracy of the model. The adjustment of hyperparameters to achieve an optimal configuration, and thus the best predictive accuracy, is defined as hyperparameter tuning and is performed by iteratively testing different hyperparameter configurations. It should be noted that a different dataset than the training one – or a subset of the training dataset – should be used for tuning the model hyperparameters.
Within the wide spectrum of machine learning approaches, deep learning represents one of the most promising techniques. Inspired by biological nervous systems, deep learning and, more specifically, deep neural networks are a subtype of machine learning methods that use several layers of non-linear functions to extract complex relationships embedded in the input data to estimate a given output.
The accuracy of predictive models derived by deep and machine learning algorithms may be assessed using common and intuitive descriptive metrics, such as sensitivity, specificity, positive predictive values and negative predictive values, and reported in the form of a receiver operating characteristic curve, as well as being expressed with the Harrel’s c-statistic. The c-statistic measures how the model discriminates between true positive and negative cases, mathematically representing the proportion of cases and non-cases discriminated by the model. In other words, a high c-statistic is observed only if patients with observed events have a higher risk than patients without events. This implies that the c-statistic provides less accurate information about the discriminative ability of the models for patients who are not at high risk, prompting the need for the use of complementary methods to describe the discriminative ability of a model in the case of a population that includes a large proportion of low-risk patients.
As it is common for the classic regression models, the calibration of the model may be presented visually (e.g. with histograms) to report the actual observed event rate with the predicted probability of the event.13 Another option is the Brier score, which expresses the difference between events predicted by the model and the actual number of events.19
In the next section, we present some examples of studies evaluating machine learning-based prediction models focused on cardiovascular events, and describe the main characteristics of some of the most common machine learning algorithms, before discussing the pros and cons of the use of these potentially breakthrough methods in the CVD field.
Artificial Intelligence and Cardiovascular Disease
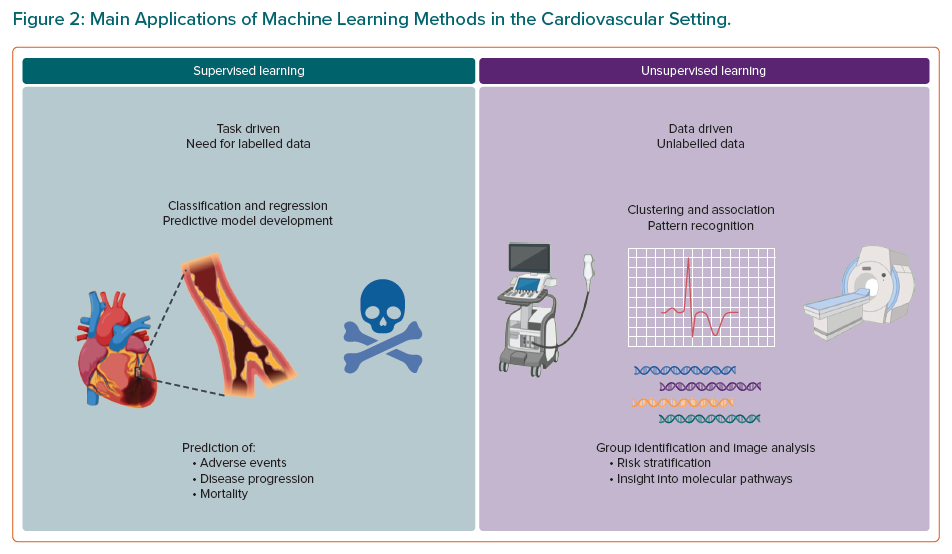
Machine learning techniques are gaining popularity in a broad range of medical domains, including the cardiovascular field. Many experts advocate for the use of machine learning techniques for prediction models in the CVD setting, given that CVD represents a classic example of complex disease requiring accurate prediction models that could benefit from the use of pattern recognition methods, especially in the subset of cardiovascular imaging. In light of the epidemiologic relevance of ischemic cardiovascular events, mainly MI, HF onset and its related hospitalisation, and cardiovascular mortality, a large number of machine learning-based prediction models have been developed to predict their occurrence. Thus, there has been an increasing interest in AI with regard to diagnostic modalities, outcome prediction, and management of these patients during the last decade.20,21 Based on the required learning task and availability of the target variable (e.g. labels), and of the required learning task, machine learning algorithms are mainly categorised into two main classes, supervised and unsupervised learning algorithms (Figure 2), which we detail in the next sections, along with some scenarios of applications in the cardiovascular domain.
Supervised Learning
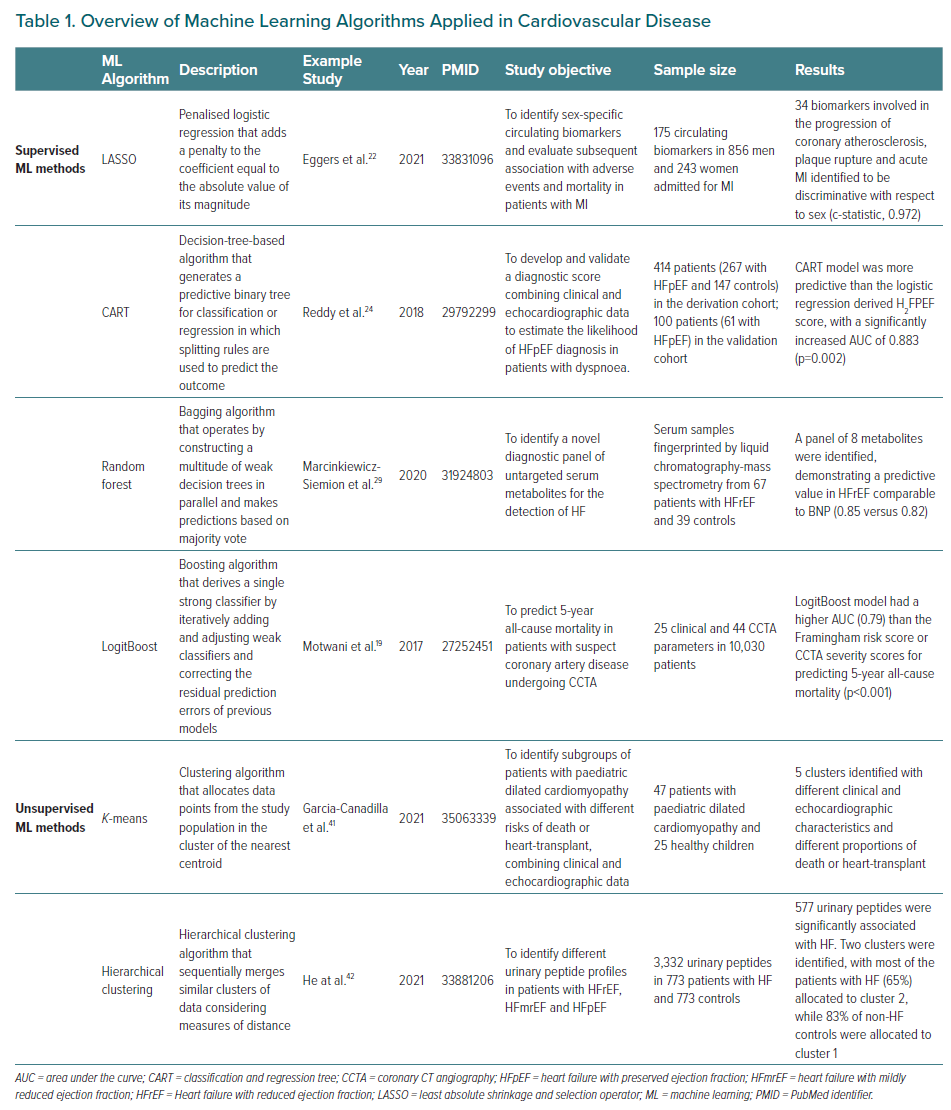
Supervised machine learning uses labelled data to develop models to determine a relationship between the input data and their associated label, with the final goal of constructing an algorithm that is able, for instance, to predict the occurrence of an outcome or to classify images according to a reference. Examples of supervised learning are listed in Table 1. These algorithms could be based on traditional regression techniques. Indeed, stepwise (forwards or backwards) selection is an example of simple supervised learning, which iteratively looks for the best subset of variables to be included in the regression model and is extremely helpful when the volume of potential predictors is large.
Other examples of supervised learning are represented by the so-called regularisation methods, such as the least absolute shrinkage and selection operator (LASSO) and ridge regression. Regularisation helps to avoid overfitting, by adding a penalty to the sum of the coefficients in order to limit the influence of predictor variables over the outcome, based on shrinkage of the regression coefficients towards a central point. Notably, this shrinkage results in altered regression estimates, which must not be used to infer the association of the predictors with the outcome. This disadvantage is counterbalanced by the possibility of obtaining a more stable model with improved predictive ability, especially when validated using external datasets. The difference between LASSO and ridge regression is related to the way shrinkage is performed. Ridge regression shrinks the regression coefficients by a similar amount, whereas LASSO regression adds a penalty to the coefficient equal to the absolute value of its magnitude. The larger the penalty, the greater the number of coefficients that could become zero and be eliminated from the model. In this case, tuning consists of a type of variable selection and specifically the amount of shrinkage, reported as λ: if λ is equal to 0, no parameters are eliminated and the coefficient is essentially equal to the one found with logistic regression; conversely, as λ increases, more coefficients will reach zero and will be eliminated, resulting in a model with increased bias and reduced variance. In other words, in the case of regularisation techniques tuning consists of the choice of the optimal penalty.
As a practical example of this approach, Eggers et al. evaluated potential sex differences in the concentrations of a large panel of biomarkers and their impact on subsequent adverse events and mortality in patients admitted for MI and enrolled in the SWEDEHEART registry. LASSO regression was used to select the biomarkers that discriminated both sexes, with a high c-statistic (0.972), and aided in the identification of sex-specific biomarkers involved in the progression of coronary atherosclerosis, plaque rupture and acute MI.22 LASSO regression was also used by Kang et al. to select the risk factors for coronary microvascular dysfunction in a small prospective study of patients presenting with MI and undergoing percutaneous coronary intervention (n=116). LASSO regression enabled the selection of 5 out of 46 variables that were associated with the occurrence of coronary microvascular dysfunction, with high discrimination (c-statistic = 0.809).23
Other examples of supervised machine learning include classification tasks, for instance, to classify images, cellular pathways and complex systems. Different machine learning algorithms could be trained for this purpose, such as decision trees, support vector machines, or artificial neural networks. Boosting (e.g. AdaBoost) and bagging (e.g. random forest) represent ensemble learning methods that enable the development of strong classification models from a number of weak classifiers (e.g. decision trees). In brief, boosting algorithms work by sequentially adding models that correct the residual prediction errors of previous models, while bagging approaches build several weak classifiers in parallel and make predictions based on a majority vote. The prespecified number of models represents a hyperparameter, which should be opportunely tuned to avoid overfitting. Motwani et al. used a boosting approach, specifically a LogitBoost algorithm, with 25 clinical and 44 coronary CT angiography parameters from 10,030 patients with suspected coronary artery disease, to develop a model to predict 5-year mortality. The study showed that the machine learning-based model had a higher area under the curve (AUC) than the widely used Framingham risk score or CT angiography severity scores alone.19 Similarly, echocardiography variables have been incorporated in a machine learning model, developed by Reddy et al., to derive a risk score for the diagnosis of HF with preserved ejection fraction (HFpEF) in symptomatic patients.24 Using a classification and regression tree, echocardiographic E/e′ ratio >9 and pulmonary artery systolic pressure >35 mmHg were combined with other clinical variables to derive the H2FPEF score in a cohort of 414 patients. When the risk score was tested in 100 consecutive patients, the H2FPEF score had an AUC of 0.841 for the diagnosis of HFpEF and outperformed the European Society of Cardiology’s 2016 algorithm for HFpEF detection (which had an AUC of 0.672).24 As well as their use in the development of predictive tools, supervised learning algorithms have also been shown to improve the diagnostic accuracy of different imaging techniques. For instance, Betancur et al. reported that support vector machines enable automatic and accurate localisation of the mitral valve plane during segmentation of the left ventricle for single-photon emission CT (SPECT) myocardial perfusion imaging, potentially resulting in reduced user dependence in this setting.25 Similarly, Arsanjani et al. showed how combining data from myocardial perfusion SPECT and clinical features in a LogitBoost algorithm might significantly improve the diagnostic performance of myocardial perfusion SPECT in comparison with expert evaluation.26
Another example of the use of supervised learning in cardiovascular medicine is represented by in silico model. In brief, in silico models apply computational models and simulations to replicate human anatomy and physiology. One of the main advantages of a verified and validated in silico model stems from the ability to simulate countless iterations of a physiological process using variations in anatomy, physiological state and/or intervention. In other words, the in silico environment enables the analysis of aspects of biology that would otherwise never be possible. In contrast to in vivo clinical testing, in which a single test usually results in a single outcome, the output of a single simulation can yield many different output fields, such as the displacement and stress and strain of deformable structural parts and velocities and pressures for fluids. Indeed, one of the most relevant applications of in silico models in the cardiovascular setting is the study of the haemodynamics of the native and bioprosthetic heart valve.27 For instance, Rocatello et al. used patient-specific computer simulations based on finite-element analysis to evaluate the effect of maximum contact pressure on the membranous septum in patients undergoing transcatheter aortic valve replacement (TAVR) on the risk of new conduction abnormalities. The authors found that contact pressure and the area undergoing contact pressure, but not the depth of valve implantation, were associated with the occurrence of new conduction abnormalities after CoreValve/Evolut R implantation.28
Machine learning approaches have also been applied to untargeted metabolomics analysis, in order to overcome limitations related to established HF biomarkers such as brain natriuretic peptide (BNP), N-terminal pro-BNP (NT-proBNP) and suppression of tumorigenicity 2 (ST2). Marcinkiewicz-Siemion et al. used random forest models to select a limited number of metabolites to develop a practical diagnostic panel for HF with reduced ejection fraction (HFrEF), evaluated in a cohort of 67 patients with HFrEF and 39 healthy matched controls. The accuracy of the model based on the eight selected metabolites did not outperform BNP alone in the prediction of HFrEF (AUC 0.82 versus 0.85), but the study demonstrated that the combination of metabolomics and machine-learning methods enables the identification of novel diagnostic panels.29
Machine learning models and multiple risk calculation scoring systems have been developed for early detection of mortality risk in patients with HF, in order to help clinicians target subsequent interventions. In 2015, Panahiazar et al. compared different machine learning models with the Seattle HF model (SHFM), a well-established model for HF survival risk. Using characteristics from electronic health records of 1,560 patients with HFrEF, the authors trained their model using different algorithms (random forest, logistic regression, support vector regression, decision tree and AdaBoost). Compared with the SHFM, their model resulted in improved performance for predicting 1-, 2-, and 5-year survival, with an improvement in the AUC of 11%; of note, logistic regression and random forest were the most accurate approaches.30 Similarly, Samad et al. incorporated clinical variables, ejection fraction and echocardiographic measurements from 171,150 patients into different predictive models developed with logistic regression, support vector machines, gradient boosting trees, classification and regression tree, AdaBoost and random forest.31 The random forest model achieved significantly higher prediction accuracy (AUC >0.82), outperforming logistic regression and conventional risk scores such as the SHFM. Incorporating echocardiographic measurements significantly improved the prediction accuracy of the random forest model, with six out of the 10 most important variables derived from echocardiography. Recently, Adler et al. reported MARKER-HF, a machine learning-derived risk score for prediction of mortality, trained in a cohort of 5,822 patients with HF.32 Including eight clinical variables, the risk score accurately discriminated between patients at low and high risk of death and had an AUC of 0.88, higher than other conventional risk scores. MARKER-HF was subsequently used to predict mortality risk in a cohort of 4,064 patients categorised as having reduced, mid-range or preserved left ventricular ejection fraction (LVEF).33 The risk score was more accurate than LVEF in all three HF categories, with c-statistics ranging between 0.83 and 0.89. Considering the high impact of re-hospitalisations in terms of healthcare system costs, poor quality of life and prognosis, predictive models have been developed to predict the risk of future hospitalisation. For example, Frizzell et al. evaluated machine learning approaches for the prediction of HF readmission in 56,477 patients; of the multiple algorithms, none performed better in the prediction of 30-day readmission than logistic regression, although it had limited performance, with an AUC of 0.624.34 Other competitive models have been developed but accurate prediction of early readmission for HF remains challenging.35 In order to define the overall predictive performance of machine learning models in HF prognosis, Shin et al. performed a meta-analysis of 20 studies with 686,842 patients.36 The authors reported better discrimination and accuracy for machine learning models than conventional statistical models with regard to the prediction of mortality and re-hospitalisation in patients with HF.
For diagnostic purposes, machine learning-based methods aim to improve diagnosis using ECGs, echocardiography, electronic health records, serum metabolites and other sources. Indeed, applying AI to ECG enables improvement of the diagnostic accuracy based on standard ECG evaluation. A large number of studies have reported how supervised learning techniques might help to identify episodic AF from an ECG acquired during sinus rhythm, as well as left ventricular dysfunction, valvular heart disease, or hypertrophic cardiomyopathy. Attia et al. used a convolutional neural network to develop a model to detect the signature of AF in ECGs recorded during sinus rhythm. The model was developed and internally validated from a sample of 649,931 normal sinus rhythm ECGs and was found to have a high predictive ability (AUC of 0.90).37 The same group developed a convolutional neural network to identify patients with ventricular dysfunction, defined as ejection fraction ≤35%, using ECG data alone.38 The model was trained retrospectively using pairs of 12-lead ECGs and echocardiogram data from 44,959 patients and subsequently tested on an independent set of 52,870 patients. The model predicted the presence of ventricular dysfunction with an AUC of 0.93 and sensitivity, specificity and accuracy of 86.3%, 85.7% and 85.7%, respectively. In patients without ventricular dysfunction, those with a positive AI screen had a fourfold higher risk of developing ventricular dysfunction than those with a negative screen.
Given the fundamental role of echocardiography in the diagnosis, classification and follow-up of HF, and the great ability of machine learning methods in medical imaging processing and analysis, the applications of AI to echocardiography represent another promising field. In 2018, Zhang et al. developed a convolutional neural network trained with 14,035 echocardiograms to determine ejection fraction, longitudinal strain and to detect hypertrophic cardiomyopathy, cardiac amyloidosis and pulmonary arterial hypertension. When the model was validated in a set of 8,666 echocardiograms, it automatically calculated ejection fraction and longitudinal strain measurements agreed with manual values with a median deviation on a relative scale of 9.7% and 7.5%, respectively; the detection of hypertrophic cardiomyopathy, cardiac amyloidosis and pulmonary arterial hypertension had a c-statistic of 0.93, 0.87 and 0.85, respectively.39 Given that ejection fraction calculation relies on either manual or automated identification of endocardial boundaries and this approach is still prone to errors, Asch et al. developed a neural network algorithm that could circumvent border detection and instead estimate the degree of ventricular contraction, like a human expert trained on tens of thousands of images.40 The algorithm was developed on a database of >50,000 echocardiograms and tested on an independent group of 99 patients. The model showed high consistency (mean absolute deviation = 2.9%) and excellent agreement with the expert-derived values (r=0.95) with a sensitivity of 0.90 and specificity of 0.92 for the detection of ejection fraction ≤35%.
Unsupervised Learning
In contrast with supervised learning, unsupervised machine learning methods are useful for developing models to identify patterns in the input data and do not require the presence of labels. This approach enables the identification of relationships between features and helps to elucidate hidden structures (e.g. patterns or clusters) in a dataset. Typical examples of unsupervised algorithms include k-means or hierarchical clustering. Neural networks (e.g. convolutional, or recurrent) are also used in an unsupervised learning setting. In particular, convolutional neural networks stand out for their ability to automatically extract patterns or clusters (even those not visible to the human eye) when the goal is to assess complex datasets such as genomic, transcriptomic, or proteomic profiles, or echocardiography or MRI, or even textual datasets. At this point in time, unsupervised algorithms are mainly used in the cardiovascular setting to identify groups of patients with similar patterns of presentation. These groups are then evaluated to improve risk stratification or provide molecular insights into the pathogenesis or progression of CVDs. K-means is one of the simplest and most common unsupervised learning algorithms. It works by grouping similar data points together with the aim of discovering underlying patterns, by looking for a number (k) of clusters in the population. The target number of centroids – the supposed or real point representing the centre of the cluster – needs to be prespecified. All data points are then allocated in the cluster of the nearest centroid. Garcia-Canadilla et al. recently evaluated a k-means algorithm to identify distinct groups of patients with paediatric idiopathic, genetic, or familial dilated cardiomyopathy based on similar echocardiographic and clinical patterns. A control cohort of healthy volunteers with no history of cardiovascular events and normal physical examination and echocardiogram was included. The algorithm identified five distinct groups with different rates of death or heart transplant, correctly identified healthy controls, and aided in a more precise prognostic stratification of affected patients.41 Similarly, He et al. used k-means and hierarchical clustering to stratify patients with HFrEF, HF with mildly reduced EF, HFpEF and controls matched for demographic features and comorbidities based on their urinary peptide profiles. The authors reported remarkable differences in multiple urinary peptides between patients with HF and matched controls, mainly related to peptides involved in dysregulation of collagen turnover and inflammation.42 Lastly, Kariotis et al. used k-means, hierarchical and spectral clustering to identify subgroups of patients with idiopathic pulmonary hypertension with different transcriptomic and clinical feature signatures. The authors identified three major subgroups with poor, moderate and good prognosis. Each group had specific upregulation or downregulation of several genes, providing important insights into the risk stratification and pathogenesis of idiopathic pulmonary hypertension.43
Pitfalls of Machine Learning-based Models
The examples in the previous sections clearly show how machine-learning models could outperform classic statistical models in terms of calibration and discrimination. The number of studies describing the development of prediction models in the field of CVD is impressive. Nonetheless, only a minority of these models have been subsequently adequately validated. A recent review showed that almost two out of three prediction models for CVD risk are not validated at all and that external validation is extremely infrequent.44 Moreover, there is a paucity of studies reporting comparisons between prediction models. Machine learning-based prediction models might be affected by these issues too. Indeed, considering the wide availability of large datasets, future research should focus on external validation and comparison of risk models, in order to provide insights into the performance of specific scores in different settings. Of note, validation and comparison of both machine learning- and classic regression-based models rely on the use of classic statistical techniques, such as the c-statistic or area under the receiver operating characteristic curve. While the receiver operating characteristic curve represents all of the sensitivity and specificity pairs for a model, the c-statistic expresses the probability that a randomly selected patient who had an event had a higher risk score than a patient who had not had the event and ranges from 0.5 to 1. Another metric is the Hosmer–Lemeshow calibration test, which provides information on how well the data fit the model, calculating whether the observed event rates match the expected event rates.10
Machine learning-based models present similar but also distinct limitations. Overfitting and limited generalisability of a model are limitations shared by classic regression techniques, but other issues are specific to machine learning-based models.
First, many predictive models are used to stratify the risk for the occurrence of adverse events at long-term follow-up, but the most widely used machine learning models are not able to account for time-to-event variations and censored patients, remarkably limiting their performance remarkably in this setting. Indeed, Li et al. showed that logistic regression and machine learning models that ignored censoring substantially underestimated the risk of cardiovascular events when compared with Cox proportional hazards models.45
Another limitation relates to the interpretability of some machine learning models. An interpretable model is important when machine learning is used in critical areas, such as in clinical practice, where an understanding of the model’s logic, functionality and results is necessary. Model interpretability encompasses both the concept of ‘transparency’, which focuses on the understanding of the model and the post-hoc explanation of the results, which involves the extraction of information from a learned model.46 In this regard, the ‘black box’ concept, which refers to a predictor for which the internals are either unknown to the observer or are known but are uninterpretable by humans, might also prevent an explanation of the predictions.47 For instance, if a high number of variables and interactions are used to predict risk in a black box model, the identification of specific therapeutic targets can be challenging or impossible. This issue could have a different impact based on the specific condition that is evaluated: many current therapeutic options for patients with established coronary artery disease are largely based on their risk for ischaemic events, irrespective of the specific causative risk factors involved in their poor prognosis. Hence, the benefit provided by an incremental improvement in risk stratification in this setting is represented by the possible avoidance of unnecessary treatments in low-risk patients, limiting the use of specific therapies to patients at increased risk. Conversely, the interpretability issue is more relevant if the aim of the model is to predict the occurrence of HF, given that in this case, it is necessary to know the relevance of the therapeutic target, in order to avoid futile treatment and potential unjustified harm.
Recent studies in the novel field ‘eXplainable AI’ (XAI) have introduced a suite of techniques to overcome the limitations of black box models. Such techniques aim to produce more explainable models, enabling humans to understand and interpret the results, while maintaining high predictive performance. One of the most common techniques, referred to as saliency masking (SM), tries to explain the outcome of a black box model by identifying a subset of the input that is mainly responsible for the prediction. The rationale is to explain what a certain model depends on locally, instead of trying to understand the full mapping learned by the black box. This local explanation aims to predict the response of the predictor in the neighbourhood of a given input. For this reason, SM is defined as a summarised explanation of where the AI model ‘looks’ to make its prediction.48 A suitable example is provided by an image classification task, where SM can be used to find the salient part of an image most responsible for the model decision.49
Lastly, it should be kept in mind that association does not imply causality. Nonetheless, machine learning predictive models could help to classify patients in different risk classes and then guide prospective studies aimed at identifying causal factors and interactions, in order to determine new therapeutic targets.
Conclusion
The use of AI in cardiovascular research and daily patient care is rapidly expanding. Machine learning-based models could outperform classic regression-based models, although this advantage is potentially lost in different settings. An adequate knowledge of the basic concepts of AI is pivotal not only to understand and exploit the potential applications of these innovative techniques, but also to critically review the literature on their use.